
As the pandemic is going on with an increasing number of deaths daily, let create a simple model to predict the deaths caused by 2019-nCoV (Wuhan Coronavirus).

The 2019-nCoV death data
I grab the death toll data from World Meters website.
| Date | Daily Deaths |
|---|---|
| Feb. 8 | 89 |
| Feb. 7 | 86 |
| … | … |
| Jan. 24 | 16 |
| Jan. 23 | 8 |
Plot the data
Firstly, we transform the table into a Pandas data frame.
death_toll = reversed([89, 86, 73, 73, 66, 64, 58, 45, 46, 43, 38, 26, 26, 24, 15, 16, 8])
data = pd.DataFrame(death_toll, columns=['death'])
data.head()
death
0 8
1 16
2 15
3 24
4 26Then we can have a look at the following graph
plt.plot(data, "ob")
plt.xlabel("Day")
plt.ylabel("Number of death")
plt.show()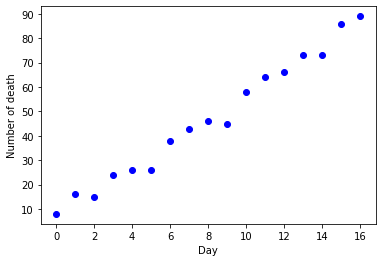
We can see that a linear regression model could be a good choice at this stage. Since we only have a very small data set (17 samples), it may not reflect correctly the trend. However, in this article, we want to implement with polynomial regression. Let review some terms:
Regression
Regression is about finding the trend in data (the relationship between variables). This allows us to better understand the data distribution and to predict the values for new input variables. The regression outputs continuous values (real values) to distinguish classification which predicts discrete values.
Linear Regression
Linear regression is used when the trend in the data is linear, i.e., it is of the form y = ax + b The other, more commonly used form of regression is polynomial regression.
Polynomial Regression
Polynomial regression used when the trend in data is a polynomial of degree ’n’, i.e., it is of the form  .
.
Keras implementation
First, we import relevant libraries. If you are new to Tensorflow and Keras, you can follow these posts.
%tensorflow_version 2.x
import pandas as pd
import numpy as np
import matplotlib.pyplot as plt
from tensorflow import keras
from tensorflow.keras.layers import Input, Dense
from tensorflow.keras.models import Model
from tensorflow.keras.optimizers import Adam
from sklearn.preprocessing import PolynomialFeatures
%matplotlib inline
We consider that the data will fit some quadratic form (n = 2), i.e.  . Therefore, we transform the day values as follows:
n = 2
X_expanded = np.expand_dims(data.index, axis=1)
poly = PolynomialFeatures(n)
X_expanded = poly.fit_transform(X_expanded)
Next, we build the model with one input and one output layer.
inp = Input((n+1))
#since one of the features is 1, we need an extra input
out = Dense(1)(inp)
model = Model(inputs=inp, outputs=out)
model.compile(optimizer=Adam(lr=1e-3), loss="mean_squared_error")
model.summary()
Model: "model"
_________________________________________________________________
Layer (type) Output Shape Param #
=================================================================
input_1 (InputLayer) [(None, 3)] 0
_________________________________________________________________
dense (Dense) (None, 1) 4
=================================================================
Total params: 4
Trainable params: 4
Non-trainable params: 0After that, we train model with 17 days’ samples and 10k epochs.
history = model.fit(X_expanded, data.death, epochs=10000, verbose=0)After training, we can check the fitting line (red) to the provided data.
plt.plot(data, "bo")
plt.xlabel("days")
plt.ylabel("2019-cCoV death")
plt.plot(data.index, model.predict(X_expanded), color="red")
Next, we want to predict coronavirus deaths in the next 9 days, from day 18 – 26th.
future_days = [i for i in range(17, 25)]
future_days_expanded = np.expand_dims(future_days, axis=1)
future_days_expanded = poly.fit_transform(future_days_expanded)
predicted = model.predict(future_days_expanded)
[print("Death in day {}: {}".format(i, j)) for i, j in zip(future_days, predicted.astype(int).reshape(-1))]
And finally, this is what we want to see but do NOT want to BELIEVE:
Death in day 17 : 97
Death in day 18 : 104
Death in day 19 : 112
Death in day 20 : 119
Death in day 21 : 127
Death in day 22 : 134
Death in day 23 : 142
Death in day 24 : 150
Conclusion
Well, it is just a simple prediction while ignoring thousands of factors. Sometimes, we can just pray and wait. Hopefully, the pandemic can be seized in the next 10 days! Cross my fingers for all 2019-nCoV patients! Below is the updated actual number of deaths for comparison:
Deaths in day 17: 97 (97 predicted)
Deaths in day 18: 108 (104 predicted)
Deaths in day 19: (112 predicted)
Deaths in day 20: 146 (119 predicted **) - abnormal
Deaths in day 21:  124 (127 predicted)
Deaths in day 22: 143 (134 predicted)
Deaths in day 23: 142 (142 predicted)
Deaths in day 24: 109 (150 predicted -> dropping point -> is Covid-19 undercontrol?)
After monitoring the data for the next few days, the model predicts quite well with some exact match, it followed the trends until the pandemic seemed to be under control.
