
While generating data in 3d space for manifold learning, I went across a problem of distributing points evenly on a sphere. It is a non-trivial problem but found a good enough solution for such placement. Interestingly, it ends up with a really cool animation effect when I decided to implement it on a mobile app.
The algorithm
There are two qualitatively different ways to achieve equidistribution of points on a surface. One is to randomly place them so that the probability is regionally proportional to the area of that region. It is based on two-dimensional Poisson statistics. This gives equidistribution on average.
The second is to regularly place points such that their distance in two orthogonal directions is locally always the same. This gives a better result (no fluctuations and no accidental overlap), but the emerging partial crystallinity could sometimes be undesirable.
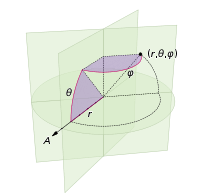
The most straightforward way to create points on the surface of a sphere are classical spherical coordinates, in which a point is addressed via its two angular coordinates, the polar angle ![\theta \in [0; π]](https://petamind.com/wp-content/ql-cache/quicklatex.com-954aca383292ffae80f9a5ed86a9cba9_l3.png "Rendered by QuickLaTeX.com") and the azimuthal angle
and the azimuthal angle ![\phi \in [0, 2π]](https://petamind.com/wp-content/ql-cache/quicklatex.com-50c75408983aba0478ffd3f2479b92a9_l3.png "Rendered by QuickLaTeX.com") . If the sphere has a radius
. If the sphere has a radius r, the Cartesian coordinates of that point are given by:
![\[\begin{pmatrix} x\\y\\z\end{pmatrix} = r \times \begin{pmatrix} sin\theta cos \phi\\sin \theta sin \phi\\ cos \theta\end{pmatrix}\]](https://petamind.com/wp-content/ql-cache/quicklatex.com-2cac0351bdd5a26f33c960d458626951_l3.png "Rendered by QuickLaTeX.com")
The algorithm is described in this paper hosted at Carnegie Mellon University.
The visualization implementation
As Colab python notebook does not allow the interactive matplotlib, I decided to implement the visualization using Kotlin in Android. First, we add some helper classes.
Point3d class
There is no Point3D class available in the Android API. Therefore, we create this class to simply store 3 coordinates x, y, z.
#Class Point3D.kt
class Point3D(var x: Float, var y: Float, var z: Float, var maxColorScale: Float) : Comparable<Point3D> {
    override fun compareTo(other: Point3D): Int {
        return z.compareTo(other.z)
    }
    var color: Int = 0
    init {
        updateColor()
    }
    fun set(x: Float, y:Float, z: Float){
        this.x = x
        this.y = y
        this.z = z
        updateColor()
    }
    //...
}
I added a colour property for this class to scale the alpha (transparent) value based on the value of z. By doing so, we can simulate the depth of field. Namely, the point will be more visible in front and more transparent in the back of the sphere. Every time we set new coordinates, we also update its colour.
#method in Point3D.kt
private fun updateColor(){
   color = Color.argb(((z + maxColorScale) *255 /maxColorScale / 2).toInt(), 0, 0, 0)
}
Animation modes
We create animations based on the transition of phases  and
and  . There are two corresponding animations, i.e. Normal (Fig 1) and AWESOME (Fig 3).
enum class AnimationMode {
    NORMAL, AWESOME
}
The Object3D class
This class renders points on 2D surface view. We use a simple and lazy technique described in this article. By default, the constructor takes 100 points on the sphere. We declare radius as 1/3 of the screen width. When a user click on the surface, the animation will switch to another.
class Object3D: SurfaceView, Runnable, Callback, View.OnClickListener {
    //Switch animation on click
    override fun onClick(v: View?) {
        mode = when(mode){
            AnimationMode.NORMAL -> AnimationMode.AWESOME
            else -> AnimationMode.NORMAL
        }
    }
    var mode= AnimationMode.NORMAL
    var radius = 100.0f
    var points = arrayListOf<Point3D>()
    var center = Point3D(0f, 0f, 0f, radius)
    var numberOfPoint3d: Int = 4
    var deltaPhi = 0.01f
    var isRunning = true
    lateinit var canvas: Canvas
    private var paint: Paint = Paint()
    init {//init variables
        paint.isAntiAlias = true
        paint.strokeWidth = 20f
        paint.style = Paint.Style.STROKE
        paint.strokeMiter = 10f
        paint.strokeJoin = Paint.Join.ROUND
        paint.strokeCap = Paint.Cap.ROUND
        holder.addCallback(this)
        setOnClickListener(this)
     }
    constructor(ctx: Context, radius: Float = 100.0f, numberOfPoint3D: Int = 4): super(ctx){
        this.radius = radius
        this.numberOfPoint3d = numberOfPoint3D
        Thread(this).start()
    }
    //...
}
The main code for placing points on the sphere is as follow:
fun updatePoint3D(){
        val modIdx = if(mode == AnimationMode.NORMAL) deltaPhi else 0f
        val modTheta = if(mode == AnimationMode.AWESOME) deltaPhi else 0f
        for( i in 0 until numberOfPoint3d){
            val idx = (i + 0.5f + modIdx )% numberOfPoint3d
            val phi = acos(1.0 - 2.0*idx/numberOfPoint3d)
            val theta = Math.PI *(1.0  + 5.0.pow(0.5 ) + modTheta)* idx
            val x = radius * cos(theta) * sin(phi) + center.x
            val z = radius * sin(theta) * sin(phi) + center.z //swap y and z axis for the trick
            val y = radius * cos(phi) + center.y
            if(i == points.size)
            {
                points.add(Point3D(x.toFloat(), y.toFloat(), z.toFloat(), radius))
            } else {
                points[i].set(x.toFloat(), y.toFloat(), z.toFloat())
            }
        }
        points.sort()//sort based on the `z` for drawing
    }
In the code, I swapped y, z to make the globe rotate on the y axis. The last line sorts the points based on z coordinate to create the depth of field effect.
And another cool animation
Conclusion
It is already fun to be able to see our data as a static image. But it is even cooler to see it animates with eye-catching moves.
The source code: Github


Interesting! Can learn from this to creat many new shapes with new shades and positions! Will definitely try! Thanks for your post!